
WOF Certified
Verified Graduate
Graduate Profile
Stephen Emeka Ekwegh
Data Analysis And Video Editor
Hi, I'm Stephen Emeka Ekwegh, a Data Analyst with a Higher National Diploma (HND) in Statistics and a passion for transforming raw data into meaningful insights that drive informed decision-making. I specialize in **Microsoft Excel, SQL, Power BI, Power Query, and AI-assisted data analysis**, with hands-on experience in data cleaning, data transformation, dashboard development, reporting, and business intelligence. I enjoy uncovering trends, solving real-world business problems, and presenting data in clear, actionable visualizations that help organizations make smarter decisions. Beyond data analytics, I am also a Video Editor, Digital Storyteller, and Content Creator. I create engaging educational, news, and documentary-style content, combining analytical thinking with creative communication to make complex information easy to understand. My GitHub showcases projects that demonstrate my practical skills in: * Data Cleaning and Preparation * Excel Dashboard Development * SQL Database Queries * Power BI Interactive Reports * Business Performance Analysis * Inventory Management Solutions * Sales and Profit Analysis * Data Visualization and Reporting I believe that every dataset tells a story. My goal is to transform raw information into insights that improve business performance, support strategic decisions, and create measurable value. I am continuously learning, expanding my technical skills, and building real-world projects that reflect industry best practices. I am open to opportunities where I can contribute as a Data Analyst while continuing to grow professionally and collaborate with teams that value data-driven decision-making.
2+
Yrs Exp.
2
Projects
1
Skills
129
Profile Views
About Me
Hi, I'm Stephen Emeka Ekwegh, a Data Analyst with a Higher National Diploma (HND) in Statistics and a passion for transforming raw data into meaningful insights that drive informed decision-making.
I specialize in **Microsoft Excel, SQL, Power BI, Power Query, and AI-assisted data analysis**, with hands-on experience in data cleaning, data transformation, dashboard development, reporting, and business intelligence. I enjoy uncovering trends, solving real-world business problems, and presenting data in clear, actionable visualizations that help organizations make smarter decisions.
Beyond data analytics, I am also a Video Editor, Digital Storyteller, and Content Creator. I create engaging educational, news, and documentary-style content, combining analytical thinking with creative communication to make complex information easy to understand.
My GitHub showcases projects that demonstrate my practical skills in:
* Data Cleaning and Preparation
* Excel Dashboard Development
* SQL Database Queries
* Power BI Interactive Reports
* Business Performance Analysis
* Inventory Management Solutions
* Sales and Profit Analysis
* Data Visualization and Reporting
I believe that every dataset tells a story. My goal is to transform raw information into insights that improve business performance, support strategic decisions, and create measurable value.
I am continuously learning, expanding my technical skills, and building real-world projects that reflect industry best practices. I am open to opportunities where I can contribute as a Data Analyst while continuing to grow professionally and collaborate with teams that value data-driven decision-making.
What I Offer
Hardworking and dependable professional with a background in Statistics, Data Analysis, warehouse operations, hospitality supervision, sales, and vegetable farming. Certified in Data Analysis with practical skills in Microsoft Excel, SQL, Power BI, and da
Portfolio
2 projects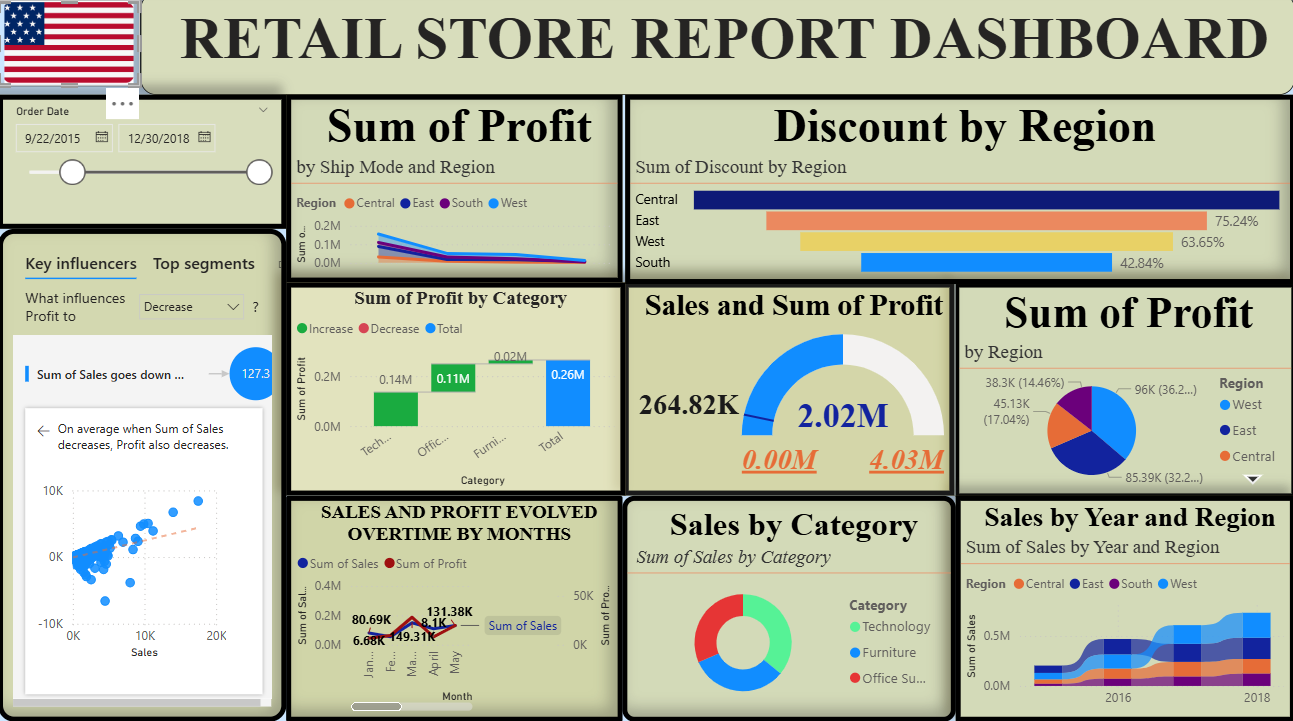 Analyze total sales and profit. Identify the best-performing regions and product categories. Find re
USA-Retail-Store-Sales-Dashboard
This project looks at the sales performance of a retail store in the United States. The goal is to understand how the business is performing by analyzing sales, profit, customers, products, and regions. The dashboard helps identify what is working well and where the business can improve.
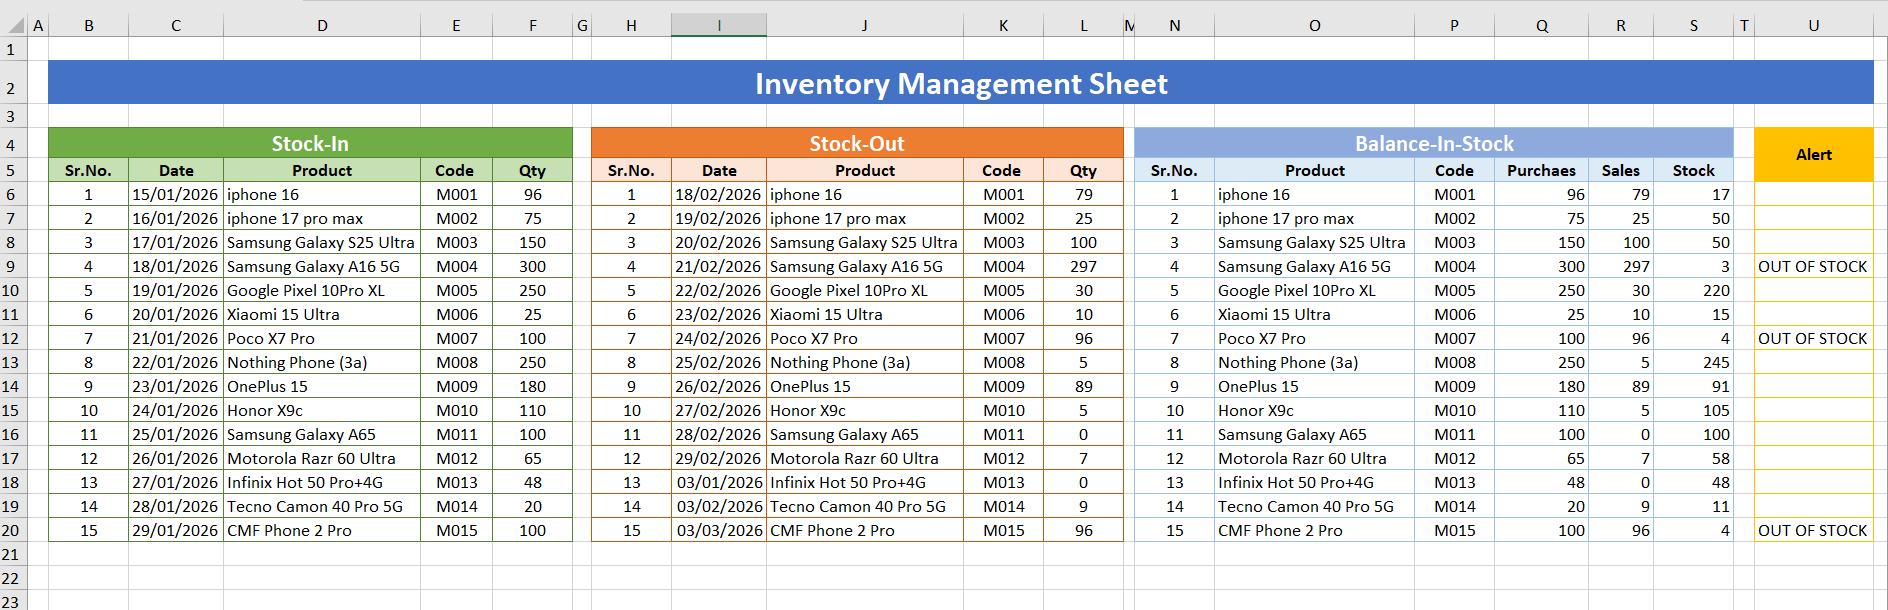 Excel Spreadsheet
Inventory Management System in Microsoft Excel
A professional Inventory Management System built entirely in Microsoft Excel to automate stock tracking, inventory calculations, and low-stock monitoring. This project demonstrates how Excel can be used as a practical business solution for managing inventory without requiring specialized inventory software.
Work Experience
Warehouse Keeper
Samsung by Dajcom
• Managed warehouse inventory.
• Organized storage areas for efficiency.
• Received and dispatched goods.
• Maintained stock records.
• Assisted with inventory audits.
Education
Statistics | Data Analysis | Video Editor
Achievements
Earned a Higher National Diploma (HND) in Statistics, building a strong foundation in statistical analysis, data interpretation, and quantitative problem-solving.
Successfully completed professional training in Data Analytics, gaining practical experience with Microsoft Excel, SQL, Power BI, and Power Query.
Developed multiple end-to-end data analysis projects, including interactive dashboards, sales performance reports, inventory management systems, and business intelligence solutions.
Built practical expertise in data cleaning, transformation, visualization, and reporting, turning raw datasets into actionable business insights.
Created an Excel-based Inventory Management Solution featuring automated calculations, stock tracking, and analytical reporting for improved inventory control.
Designed interactive Power BI dashboards that communicate key performance indicators (KPIs) and support data-driven decision-making.
Applied SQL to query, organize, and analyze relational databases using joins, aggregations, filtering, and reporting techniques.
Produced professional GitHub portfolio projects that demonstrate real-world analytical skills and adherence to documentation best practices.
Combined analytical and creative skills by producing educational and documentary-style digital content, effectively communicating information to diverse audiences.
Committed to continuous professional development by consistently building new projects, learning emerging analytics tools, and expanding expertise in business intelligence and data visualization.