
WOF Certified
Verified Graduate
Graduate Profile
Desmond Ibeanusi
Data Analyst/Business Developer
I am an Economist, Business Developer, Data Analyst, and Lecturer with over four years of teaching experience in higher education. I specialize in transforming data into actionable insights that support strategic decision-making and business growth. My strengths include data analysis, market research, problem-solving, dashboard development, and business strategy. Proficient in Excel, Power BI, SQL, and business intelligence, I help organizations improve performance, identify growth opportunities, and make informed, data-driven decisions.
1+
Yrs Exp.
8
Projects
3
Skills
268
Profile Views
About Me
I am an Economist, Business Developer, Data Analyst, and Lecturer with over four years of teaching experience in higher education. I specialize in transforming data into actionable insights that support strategic decision-making and business growth. My strengths include data analysis, market research, problem-solving, dashboard development, and business strategy. Proficient in Excel, Power BI, SQL, and business intelligence, I help organizations improve performance, identify growth opportunities, and make informed, data-driven decisions.
What I Offer
I help businesses make informed decisions by analyzing data, creating interactive dashboards, identifying growth opportunities, optimizing business processes, and delivering actionable insights using Excel, Power BI, SQL, and business intelligence techniq
Portfolio
8 projects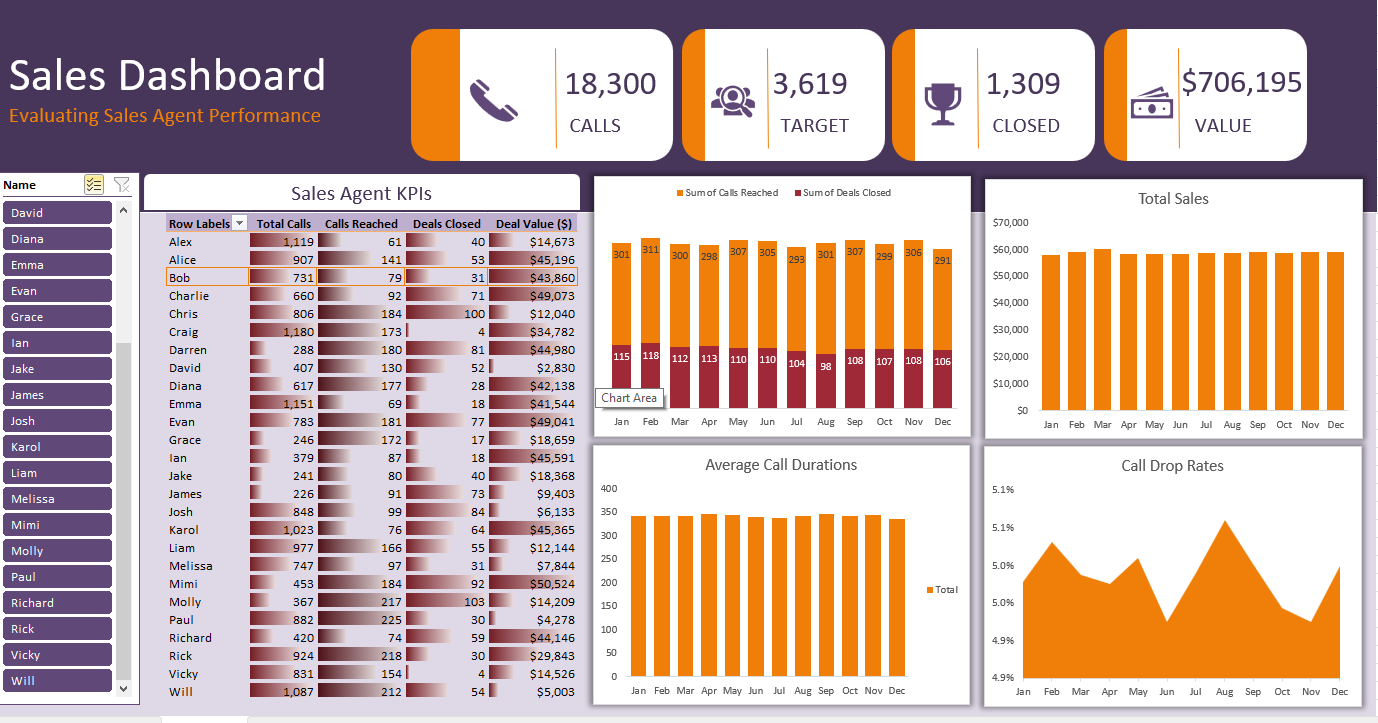 ★ Featured
Data Analysis
Sale Agent Performance Analysis
This project was developed for a sales agency to analyze its performance over a one-year period. The dashboard provides insights into: 1. The total number of leads reached and deals successfully closed. 2. Monthly sales performance throughout the year. 3. The average duration of sales calls. 4.Call drop rates to evaluate communication efficiency.
Restaurant Operation Analysis
I worked on a restaurant dataset to identify the best- and worst-performing menu items and determine which dishes the top customers prefer the most.
 Data Analysis
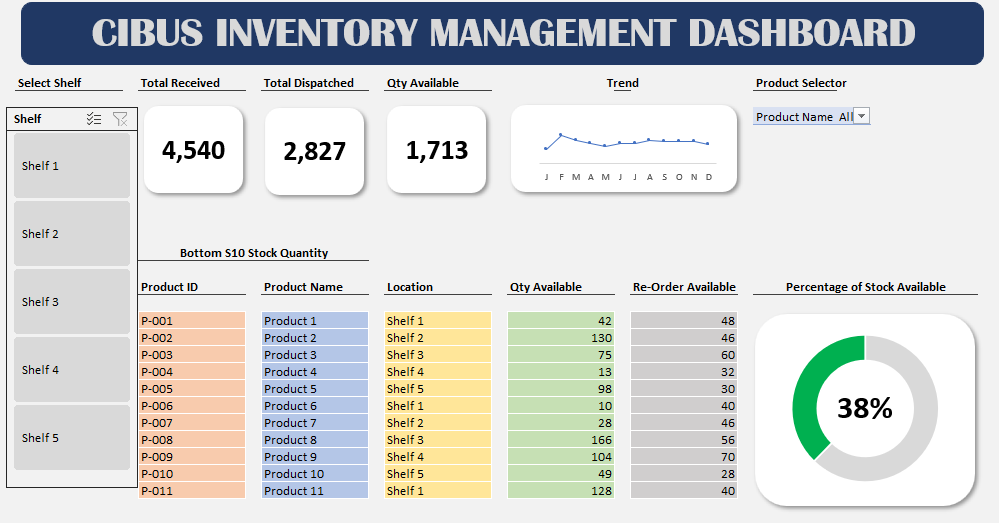
Cibus Inventory Management Dashboard
I developed the Cibus Inventory Management Dashboard to monitor key inventory metrics, identify the bottom 10 stock quantities, analyze the percentage of total stock available, and track monthly stock quantity trends. The dashboard also features three key performance indicators (KPIs) and interactive slicers for effective data filtering and analysis.
 Data Analysis
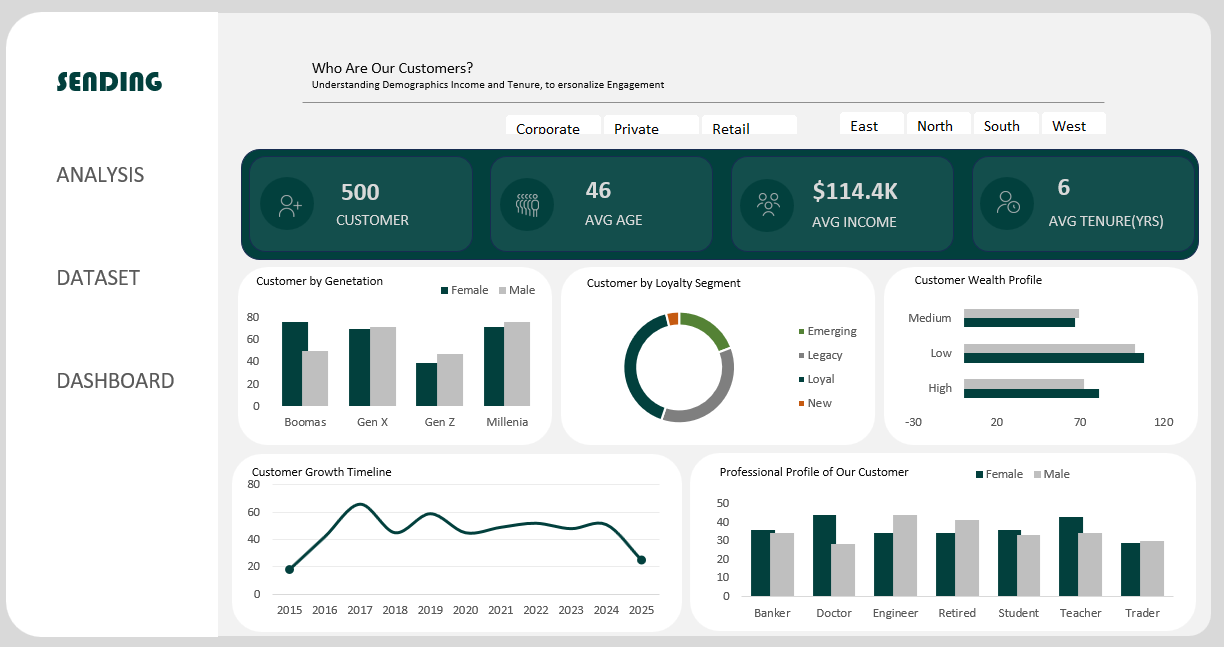
Customer Segmentation Analysis
Customer Segmentation Dashboard – Financial Institution This Customer Segmentation project analyses and segments customers of a financial institution based on age group (generation), customer loyalty, income level (wealth profile), customer trends over the years, and occupation. The project was developed using Excel Power Query, with a dynamic dashboard that allows users to interactively explore and filter customer data using slicers. Two slicers were incorporated into the dashboard: Region and Customer Segment, enabling users to narrow down the analysis and gain more specific insights. Customer Segmentation Criteria 1. Generation Segmentation Customers were classified into generational groups based on age: Gen Z: 28 years and below Millennials: 29–44 years Gen X: 45–60 years Boomers: Above 60 years 2. Loyalty Segmentation Customers were segmented according to their years of patronage: New: Less than 1 year Emerging: 1–3 years Loyal: 4–7 years Legacy: Above 7 years 3. Customer Wealth Segmentation Customers were grouped according to their income level: High: Up to $100,000 Medium: $100,001–$150,000 High/Premium: $150,001–$300,000 Premium: Above $300,000 Dashboard KPIs The dashboard contains four key performance indicators (KPIs): Total Customers: 500 Average Age: 46 years Average Customer Income: $114K Average Tenure: 6 years Overall, the dashboard provides an interactive and dynamic view of the institution's customer base, enabling users to understand customer demographics, loyalty patterns, wealth profiles, regional distribution, occupational segments, and customer trends over time.
 Data Analysis
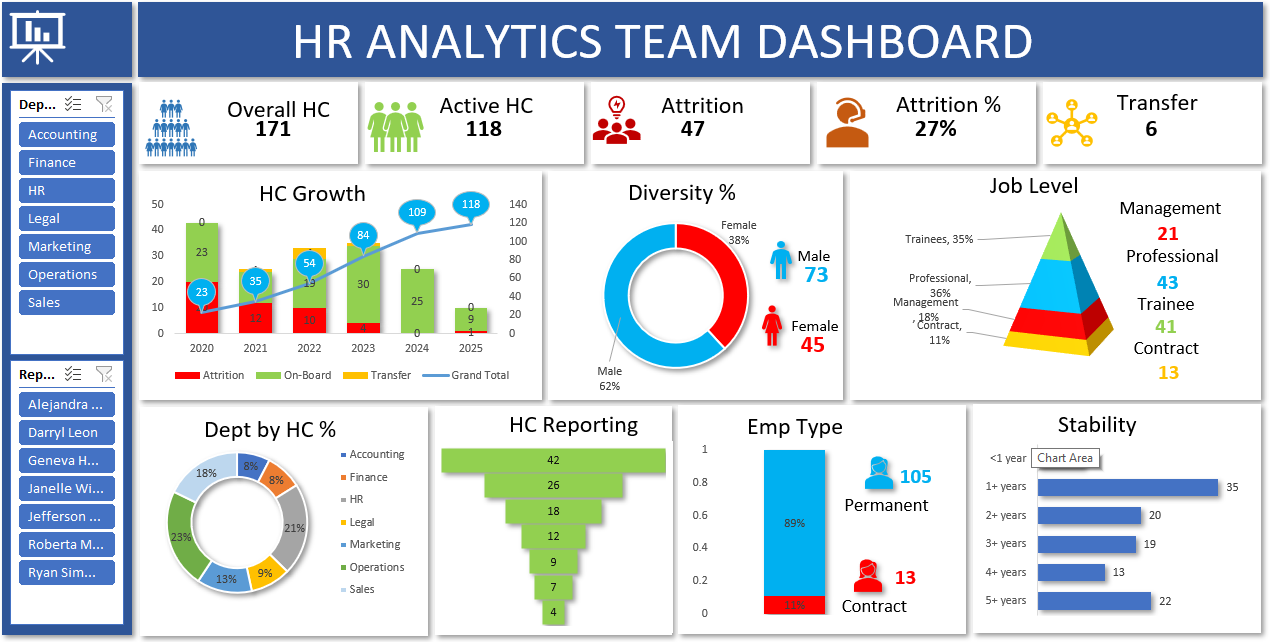
Cibus Foods HR Analysis
This project addresses key HR questions for Cibus Foods, including: 1. What is the total employee headcount? 2. What is the gender distribution of employees in percentage terms? 3. How are employees distributed across different job levels or grades? 4. What percentage of employees belongs to each department? 5. How many employees report to each manager? 6. What is the distribution of employees by employment type? 7. How stable is the organization’s workforce? Key insights from the analysis were summarized using KPIs, while slicers were incorporated to enable deeper analysis and easy filtering by reporting manager and department.
 Data Analysis
E-commerce Dashboard
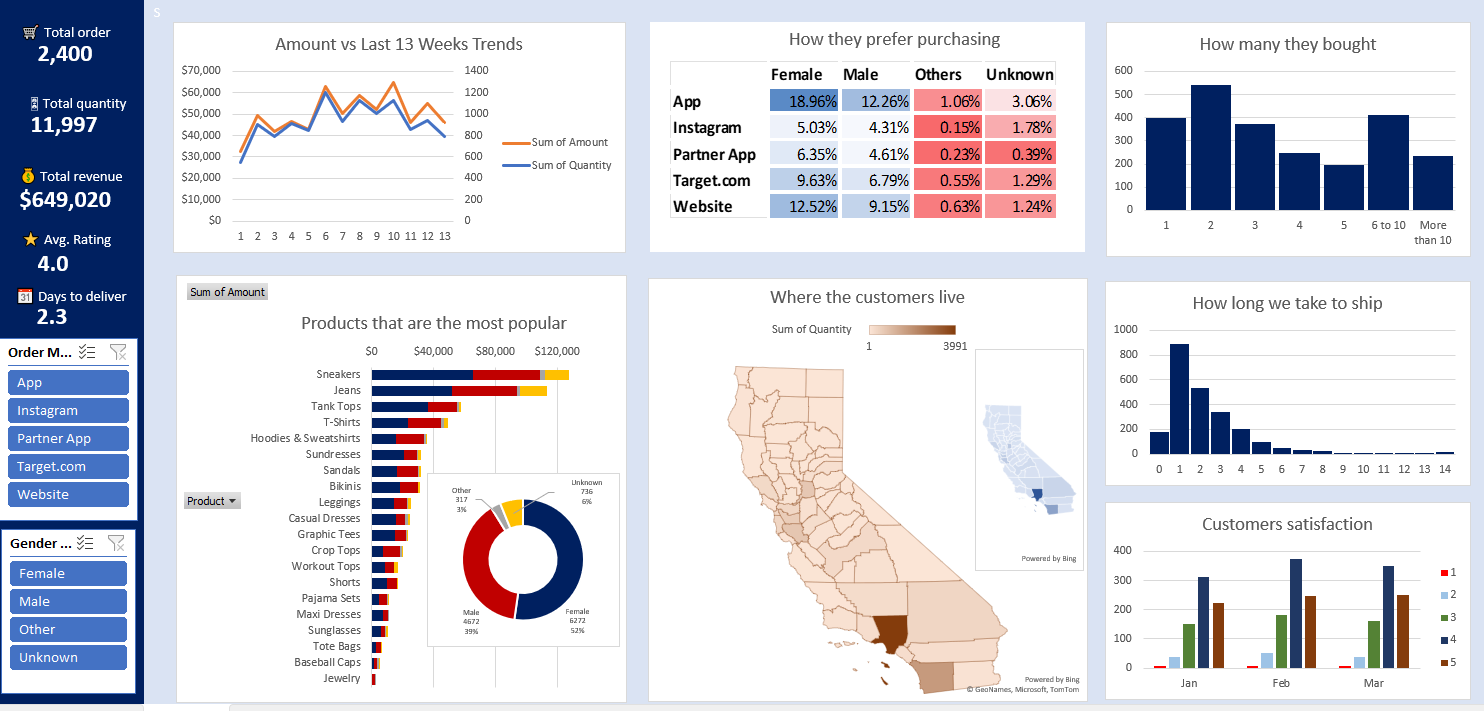
This project was carried out to answer the following business questions for an e-commerce business: 1. What is the trend over the last 13 weeks? 2. How do our customers like to buy? 3. How much do they buy? 4. Which products are the most popular? 5. Where do our customers live? 6. How long does it take to ship orders? 7. How satisfied are our customers? The following KPIs were included in the dashboard to provide a summary view of the business performance: 1. Total Orders 2. Total Quantity 3. Total Revenue 4. Average Rating 5. Average Delivery Time (Days)
 Data Analysis
Bike Sales Dashboard
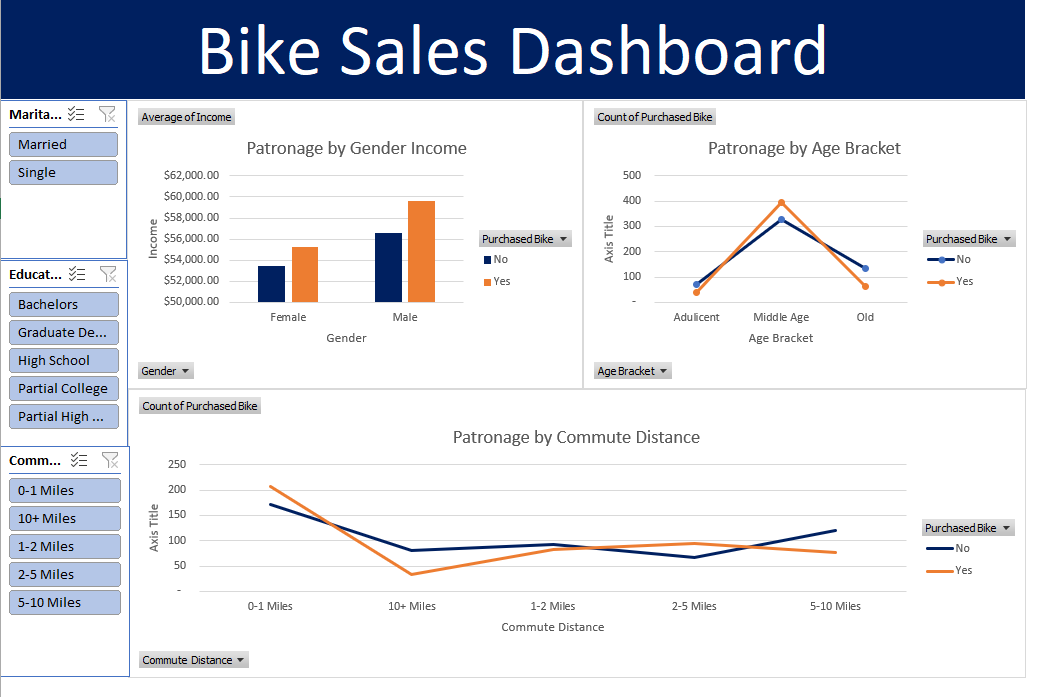
This dashboard provides insights into key customer patronage trends, helping the bike store owner better understand buying behaviour. It answers the following business questions: 1. How does customer patronage vary by gender income? 2. Which age groups contribute the most to customer patronage? 3. How does commute distance influence customer patronage?
 Data Analysis
Coffee shop sales
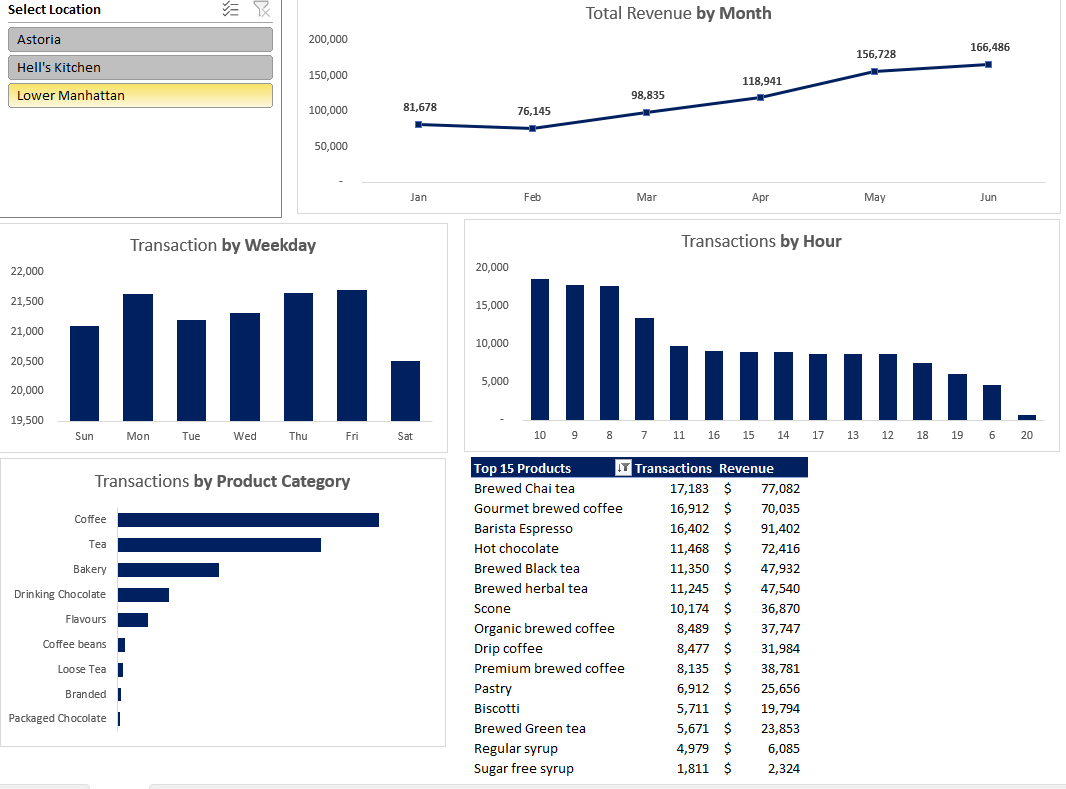
Coffee Shop Sales Dashboard Project Developed a fully interactive and dynamic sales dashboard that transforms raw coffee shop sales data into meaningful visual insights, enabling franchise owners and business managers to make informed, data-driven decisions with ease. Key features of the dashboard include: Designed a dynamic and interactive dashboard for real-time business performance monitoring. Created a monthly revenue analysis panel to track sales trends and identify growth patterns. Built a weekday transaction analysis panel to evaluate customer purchasing behavior across different days of the week. Developed an hourly transaction dashboard to identify peak business hours and optimize operational planning. Designed a product category performance panel to analyze transaction volumes across different product categories. Created a Top 15 Products report displaying product sales counts alongside generated revenue, helping identify best-selling and highest-performing products. This dashboard provides actionable business insights that support strategic decision-making, inventory management, staffing optimization, and revenue growth.
Work Experience
With over four years of lecturing experience in higher education, I have developed expertise in teaching, research, and academic mentorship. Alongside my academic career, I specialize in business development and data analytics, applying Excel, Power BI, SQL, and EViews to analyze data, build interactive dashboards, conduct econometric analysis, generate business insights, and support data-driven decision-making for individuals and organizations.
Education
I hold a Bachelor's degree in Economics and have advanced postgraduate training in the field. My academic background has equipped me with strong analytical, quantitative, and research skills. I am proficient in Excel, Power BI, SQL, and EViews, with expertise in data analysis, econometric modeling, business intelligence, and statistical analysis to support evidence-based decision-making and solve complex business and economic problems.
Achievements
Recognized for academic excellence, research contributions, and a commitment to professional development. Successfully completed data analytics and econometric research projects, presented scholarly work at academic conferences, and consistently applied analytical and problem-solving skills to deliver impactful, data-driven solutions for business and economic decision-making.